Yesterday, my colleague Arthur Perret has published a great piece, titled “What is the point of a graph view?”. As a point of departure, he used my announcement from the weekend that Zettlr would finally get a graph view. He is very attentive and has correctly picked up the subtext of the tweet:
The announcement itself had a weird ring to it: I had to read it a couple times to make sure it did say “Here, have a graph view,” with that dejected undertone—it’s almost as if he’s saying “Happy now?” Later, Erz clarified his position, confirming my interpretation: he called the graph a “nice toy” but inferior to note-taking techniques and full-text search.
I am clearly in favor of search functionality. Conversely, he is in favor of graph views, as becomes clear later in his article, where he discusses pitfalls of searches:
[T]hese traditional documentation techniques have been marginalized by search. Everything has a search bar now, from file systems to email clients. In some applications, even menus can only be accessed through search—I’m referring to the command palette, which is spreading among text editors and which I personally dislike with a passion. Obviously, note-taking tools are no exception: they focus heavily on search, leaving links, tags and metadata fall by the roadside. As we will see later, search cannot do everything, so this is problematic.
So the pivotal question here is: Graphs or full-text search? Or both? And what does a potential answer to these questions means for the art of personal knowledge management (PKM) more generally? In this article, I would like to pick up this line of thought and argue what position graphs and full-text search can take within our own workflows of taking notes.
An “Incomplete Digital Turn”
Let me start off with a quote that is so on point that it has become my default starting point for discussions circling around PKM. My colleague Anna Weichselbraun once said that with the appearance of personal computers on the academic stage, academia has made an “incomplete digital turn”. What she means by this is that researchers now had these shiny new things, but they essentially treated them like typewriters.
The advent of the computer in academia has effectively replaced the physical piece of paper with a digital representation of a piece of paper, leaving everything else constant. Microsoft Word, which has been around for pretty much the same time as the personal computer, is the perfect example. Ben Balter has exquisitely summarized this on his blog:
The creators of the first desktop word processors simply mirrored the dominant workflow of the time: the typewriter. The final output — the sole embodiment — was physical, and all that mattered was what the document looked like.
However, a computer is obviously more powerful than to replace your familiar typewriter, and more than thirty years after it has taken over the university offices of the world, people are gradually realizing this. Two methods that are specifically enabled by computers are at the heart of Perret’s article: network graphs and searches. However, as will become clear, our current digital approaches to note-taking still suffer from this incomplete digital turn, and neither searches nor graphs are any exception.
From Bulky Concordances to Spurious Searches
The increasing volume of written text brought with it a unique problem: how to find anything ever again in the growing pile of words. For most part of the recorded history, humans did not have computers. Instead, a plethora of shortcuts and workarounds were invented that aided humans in searching for particular things in texts.
One of the first ways of doing so was to create so-called concordances. Concordances are essentially indices that contain the principal words of a long text, together with page numbers and some context such as a definition or explanation. Most famously used by clerics to counter heretics by being quicker than them in coming up with good counter-arguments from the bible, they facilitated searching through text via analog means.
There are other ways of creating shortcuts for not having to read through large amounts of text manually, and a few important ones are again listed in Perret’s article, so I won’t reiterate them here. However, when computers became affordable to people, and more and more text became digitized, it turned out computers are much faster than humans to search within these digital representations of text. Even more so, because computers can work with text as-is there is no need to prefabricate indices, skipping the additional work to make text accessible altogether.
However, the full-text search came with it its own set of problems. A computer still cannot think, so you have to come up with potential synonyms to include in your search yourself. In a similar vein, if you are working with some set of relevant texts, no term-based search can give you related files. A computer has no concept of a relation that is not clearly defined. While we as humans just know that the words “Mulholland Drive” are strongly connected to “David Lynch”, a computer sees two strings of letters that don’t even have many characters in common.
Going back to the PKM world: by relying on search functionality too much, we are prone to forget to look out for related notes that don’t necessarily show up in a search. A potential solution to this is to explicitly create cross-links between notes as you write them. This way there is still a search for related notes involved, but if you suddenly stumble upon a note, you can directly create a cross-link to always find that note again in the future. But then, how do you assess the structure of this network you are spanning? Enter graph views.
The Fallacies of Network Graphs
When you cross-link notes, you are slowly creating a network. That is something researchers such as Niklas Luhmann leveraged to become utterly productive, and create insight after insight. Computers now give us an additional tool to make sense of what we create: A visualization of that knowledge graph. The way from cross-links to a network visualization is very short, and so it became an almost natural addition to tools that facilitate interlinking between files.
Perret incidentally quotes Mathieu Jacomy to make the point that such network graphs always serve a function, despite looking like mere appearances without inherent meaning. Let me here quote another article from Jacomy, “The problem with network maps”. In that article, he reflects on network visualizations and makes an important observation: creating a network involves a set of arbitrary decisions that the algorithm has to make. But, as humans we are used to detecting patterns, so whenever we look at a network, we immediately attempt to make sense of it. And that can lead to critical errors in judgment.
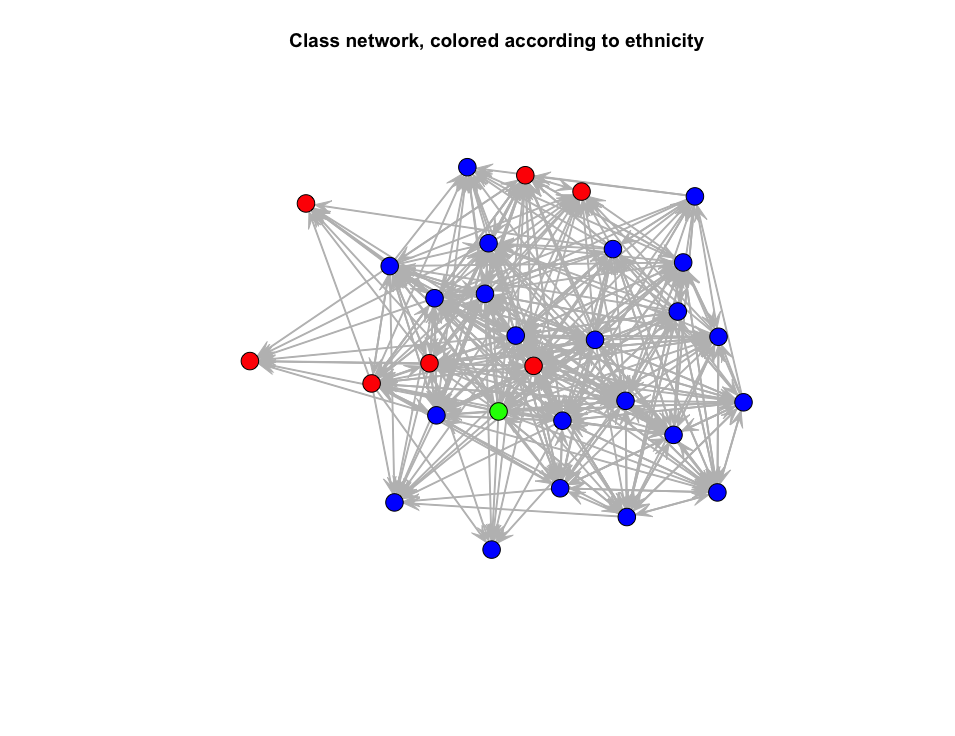
Let me give you one example which I have ready at hand: For a course in Social Network Analysis (SNA) I had to visualize a network of mutual nominations of school children “liking” or “being good friends” with each other. I colored the actors based on ethnicity (since that was the variable available), and it looks like this:

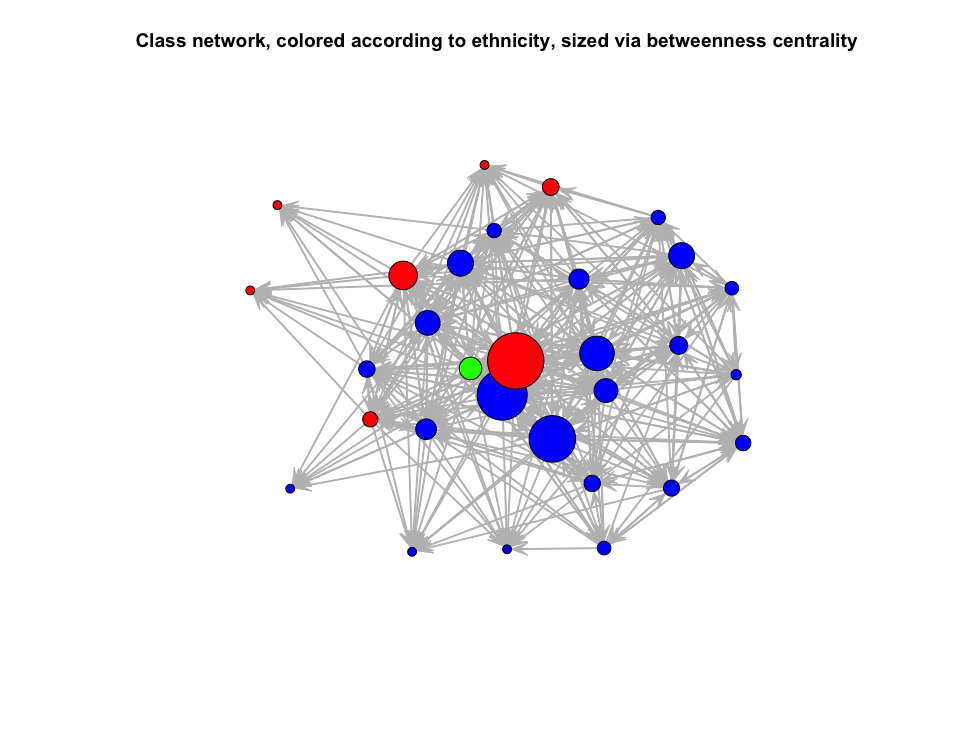
Ignoring the green dot for now (it indicates a person for which this variable was not given), you will immediately see that many red dots are at the borders of the network, and one red dot is almost at its core. So that red dot must be important, right? There is a metric called “betweenness centrality”, which captures the centrality of a given actor based on the connections it facilitates.

As you can see, that red dot is indeed in an extremely central position. My first intuition was to hypothesize that the red dot probably connects the red dots at the outskirts of the network to its core. That is the state in which most note-taking tools’ graph visualizations stop. But in this case, our intuition is far from the truth.
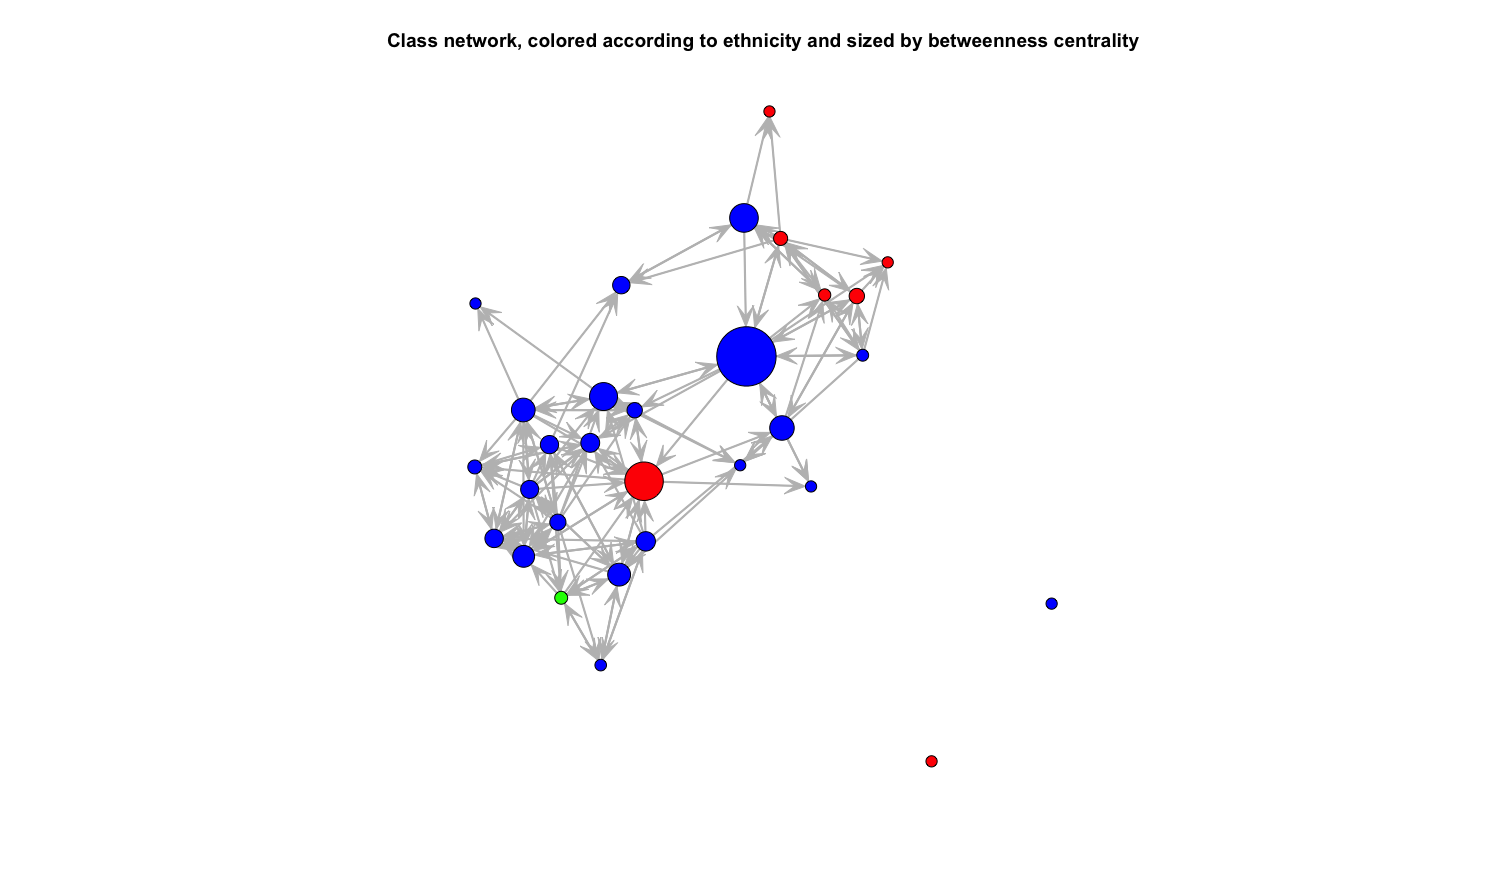
Later, I had a look at that network again, but this time I only included nominations for “being good friends” and omitted the lesser “like” nominations. The network suddenly looked like the following:

My initial hypothesis was completely wrong: That one red dot did not, in fact, connect the other red dots to the core of the class network. Rather, it was part of the core all along. What connects the other red dots is one of the blue dots.
What does this example tell us? It shows that paying attention to what a network’s visualization implies is of utmost importance. Just plotting a network because it looks nice makes it easy to fall into the trap of spurious correlations. As humans we want to identify patterns so badly that this leads us into sometimes grave mistakes.
Perret is aware of the potential pitfalls, and thus he puts the focus on the utility of such a graph view alongside healthy note-taking habits:
You start looking for patterns, not just in the things you write about but also in the writing technique itself: what kind of notes am I writing, what kind of links am I making, etc. […] In turn, this helps you decide how the notes should be modified: locating isolated notes, which you may want to link to the rest of the graph; identifying an emerging cluster of notes, which you may want to study further; etc.
However, as the sociologist John Mohr warned more than twenty years ago (1998, p. 367): “Any visual representation of a meaning structure is still largely a Rorschach test upon which one must seek to project an interpretation.”
NLP to the Rescue?
As I have shown, both a full-text search and a visualization of a knowledge graph can lead us to grave errors in judgment. So, are we doomed never to successfully utilize the power of computers to actually increase the efficiency of our work? Is our fate to either forget important related notes or see patterns in visualizations that are simply not there? As always, there is a middle ground.
The weakest link of the full-text search is the lack of semantic understanding by your computer. The weakest link of the graph view, on the other hand, is your instinctive search for patterns. While our computer is good in stoically sifting through large amounts of data, we are good at finding meaning. In order to avoid the problems of a full-text search, we need tools that show us related files which we otherwise would miss. Likewise, we need tools that show us connections between notes without making us fall into the trap of detecting patterns in some Rorschach test.
One way to evenly split the work between you and your computer is to have your computer facilitating connections which you then judge based on your ability to understand semantics. We always make connections between our texts, but without explicit links between notes our computer cannot find them. We make these connections by using similar words and a similar grammatical structure. We make these connections implicitly. When we take notes, we are always working on a network, even if we never link two notes explicitly.
In 1957, John Rupert Firth has coined one of the central statements of computational linguistics: “You shall know a word by the company it keeps”. I have already written on the significance of this statement here on this blog. I warmly recommend this article, as it explains many of the underlying ideas that will also shape the development of Zettlr in the years to come.
In the context of note taking, this means that with new techniques, sometimes only a few years old, we can have our computer search for connections between notes by looking at the words we use. This way, our computer can learn to identify synonyms on its own. By displaying this information in the appropriate places, our note taking tools can show us the network of our knowledge without either of us having to make any grave mistakes.
As a case study, I already implemented one way of training your computer to find connections based on words alone. It still relies on syntax, but that syntax is simpler than linking notes: It utilizes the keywords you can put into notes. To create these keywords, you do not need to look at other notes, since they only relate to the content of the one particular note. But in their totality, they form a network of notes that Zettlr displays you in its sidebar: Sorted by the amount of shared tags you will find a list of possibly related files. You will not make any pattern errors because it is not a visualization, but you will also not miss notes just because they don’t appear during a full-text search.
There are much more powerful methods out there, but until these are suitable for the productive, day-to-day use in Zettlr, it will take some time of development. Luckily, I’m writing my dissertation on these topics.
Final Thoughts
I hope that I have outlined in a way you could follow what I think the problems with network visualizations are. I agree with Arthur Perret in many instances, and there is a large common ground that connects our striving for improving the way we take notes. However, while Arthur clearly focuses on improving the way he personally takes notes, I believe that computers can take much more work off our shoulders.
I believe that in order to truly make the digital turn in the humanities complete, we have to find ways of utilizing our computer better. Both switching to Markdown-based writing programs as well as visualizing the network of our notes are important and big steps into the right direction. But I believe that we should not waste precious mental resources trying to interlink files in the hope that, after years of nurturing such a “digital garden”, as some call it, novel ideas fall out of them.
Arthur ends his article in a somewhat dramatic way:
Because [screenshots of knowledge graphs on Twitter are] superficial, it gets tiresome, and I’m a little worried that people like Hendrik Erz, who could do phenomenal things with graphs, may not give them the attention they deserve, because they’re being nagged by users who just want the feature for a screenshot.
Let me also end this article in a dramatic way. I truly value the book “How to take smart notes”, but over the past two years, I have gained an important insight: that whole book does not work as advertised. It is not that Ahrens is missing something obvious. Rather, new insights do not necessarily come about by interconnecting already existing thoughts. New insights come around because we do other things when we don’t write.
We do experiments, we run analyses, we observe people, nature, social behavior. And then we need to contextualize our observations and results with things that have been written before us. Likewise, what other people have done before us influences where we will go. It is a dialectic relationship between the past and the future. Both a full text search and a graph view let us sift through the past for clues what might be interesting to explore in the present. And our present will be the past of some future knowledge graph by the generation coming after us. So why should we spend so much time charting the past if our computer can do that for us, and rather focus on what lies ahead?
Do not hesitate, I will do more things with graphs, maybe even phenomenal ones. But instead of blindly following Twitter hypes, I always try to thoroughly understand a problem before I solve it.
References
- Mohr, J. W. (1998). Measuring Meaning Structures. Annual Review of Sociology, 24, 345–370. https://doi.org/10.1146/annurev.soc.24.1.345